Modality, Skewness, and Kurtosis
Distribution Shape Concepts
Modality
Unimodal (one peak), Bimodal (two), Multimodal (many) — peaks reveal sub-populations.
Positive Skew
Long tail on the positive (right) side. Mean > Median. Common with income data.
Negative Skew
Long tail on the negative (left) side. Mean < Median. Less common in real-world data.
Kurtosis
How fat the tails are. High kurtosis = more outliers; low = thin tails. Matters for risk modeling.
Noble Desktop's Python Programming Immersive covers AI APIs, data analysis, and modern Python development.
This article will discuss different ways to describe visual data, this topic is a bit different from the others as it is less technical math and more learning how to interpret the graphs that you built using the math we learned.
What good is it if you build these complex distribution charts but cannot fully extrapolate all the information from them, that sounds like inefficiency to me. Modality, Skewness, and especially Kurtosis might seem like daunting words, but they are very intuitive. For example, look at the graphs below – what do you notice? The first thing that most people will notice is that the graph “peaks” at 50 and does not really have a true peak at any other value, rather some small increases.
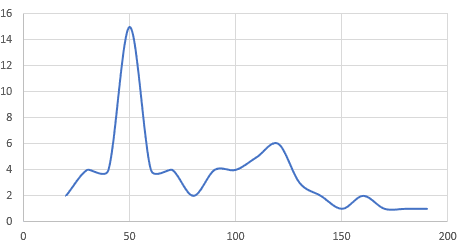
In mathematical terms, this graph would be considered Unimodal, meaning that the data has one peak. If at another point in this graph – there was a value with the same frequency level of 50 then this graph would be considered Bimodal. Furthermore, if the graph has multiple points that have the same maximum frequency value than it would be considered Multimodal. The basics of this topic are digestible and might seem rudimentary, but they are vital when a programmer is trying to model real-life events using machine learning.