Browser Developer Tools & Validating HTML
What This Tutorial Covers
Inspect Element
Live-edit HTML and CSS to debug layouts.
HTML Validator
W3C tool flags malformed markup.
Console & Network
Surface JS errors and resource load times.
Noble Desktop's Front-End Web Development Certificate teaches HTML, CSS, and JavaScript — the complete front-end foundation.
Dive into this detailed HTML and CSS tutorial which covers topics such as opening the DevTools in Chrome, editing HTML in the DevTools Elements panel, enabling, disabling, and editing CSS in the DevTools, using DevTools to fine-tune your CSS, hexadecimal shorthand, and checking for errors: validating your code.
Exercise Preview
Using Chrome’s DevTools
- Preview index.html in Chrome.
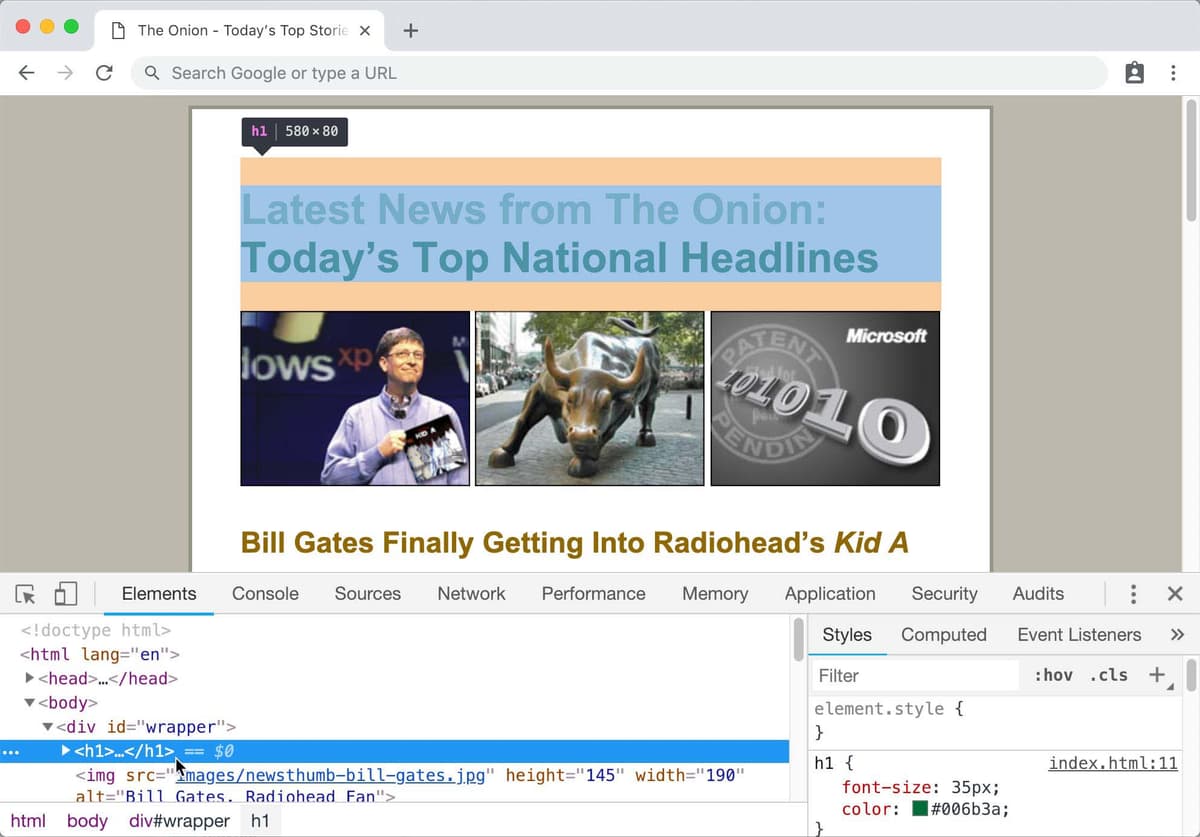
To open the DevTools, CTRL–click (Mac) or Right–click (Windows) on any of the images near the top of the page and choose Inspect.
NOTE: The element you CTRL–click (Mac) or Right–click (Windows) on will be initially selected in the DevTools.
We want the DevTools docked to the bottom. If the DevTools are docked to the right side of the browser window, at the top right of the DevTools panel click the
 button and then choose Dock to bottom as shown below:
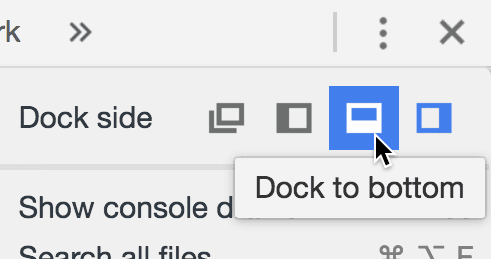
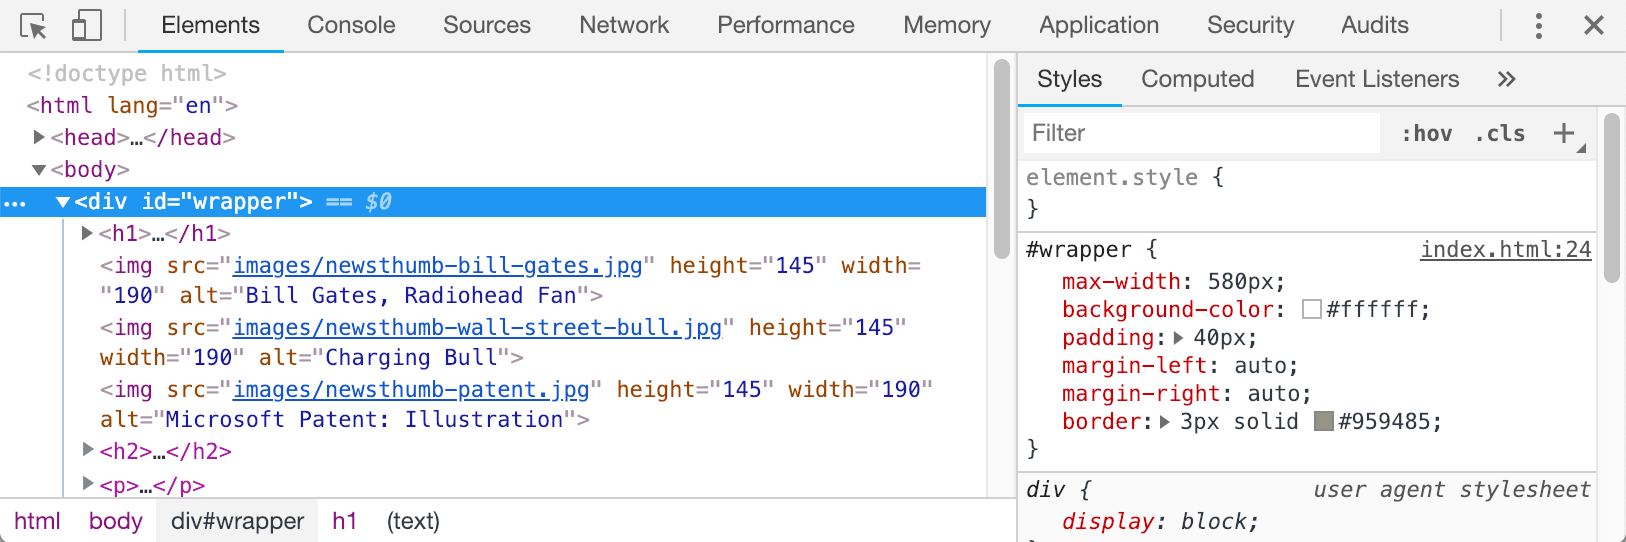
The DevTools are organized into tabbed panels. The Elements panel should currently be open on the left side. Here, you can view and edit all elements in the DOM tree (DOM is short for Document Object Model), which is a fancy way of saying you can see the structure of the document and the way each HTML element is nested inside another.
Hover over some of the tags, noticing that as you do so, the element will be highlighted in the browser window above (along with a tooltip that shows the HTML element’s width and height).
- While you’re here, also take note of the arrows that can be opened and closed to show the contents of the HTML elements. Experiment a little by opening up the
<h1>tag (directly above the three img tags) to see the content. Notice the nested
<span>and<br>tags. It is helpful to know that the<h1>is considered the parent element and the<span>and<br>are child elements within the<h1>. Following this logic, the<span>and<br>elements are siblings according to the structure of the DOM tree.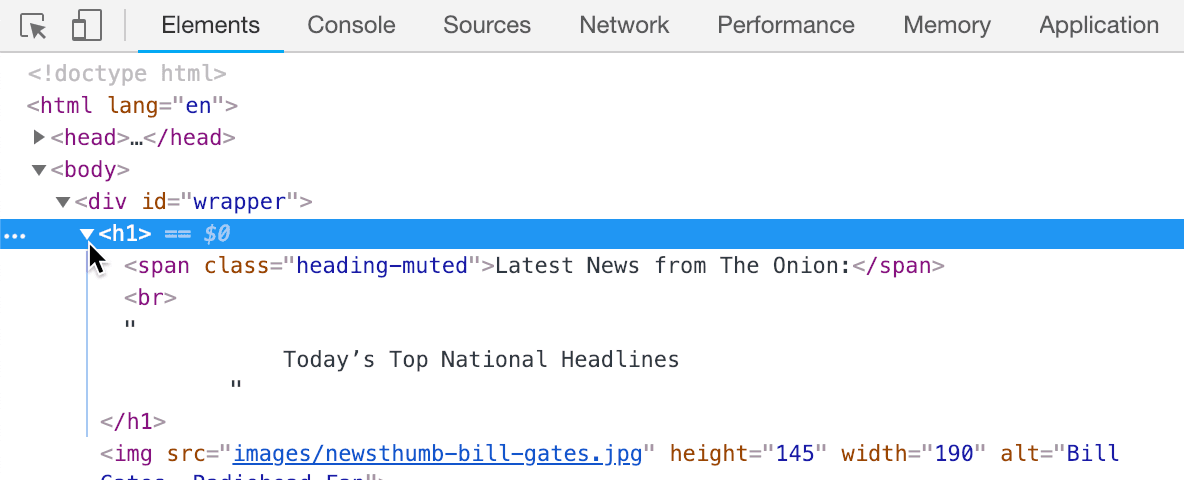
Double–click on the text inside the
<h1>element and type out some new text (whatever you want), as shown below: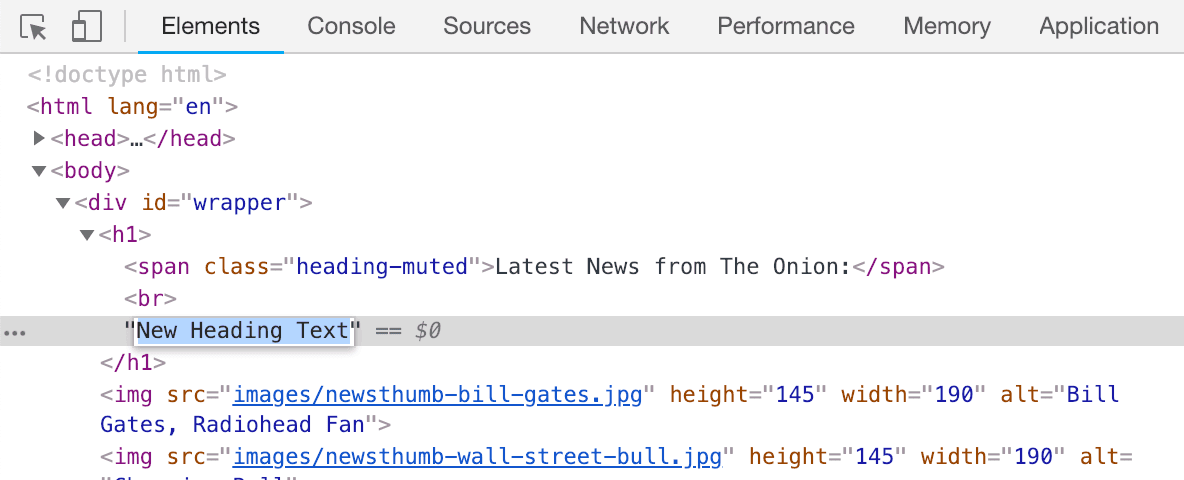
Hit Return (Mac) or Enter (Windows) to see the change in the browser window above the DevTools. Wow, that’s cool!
Play around for a bit and have fun. Don’t worry, the changes you make in the DevTools are temporary (they are not saved into the HTML file). You need to modify the content in your actual HTML file to save the changes.
- Reload the browser to see the original content once again.
- Click on the
<div id="wrapper">tag in the DevTools, which is just below the<body>tag. Look at the Styles panel on the right to see the CSS for this element.
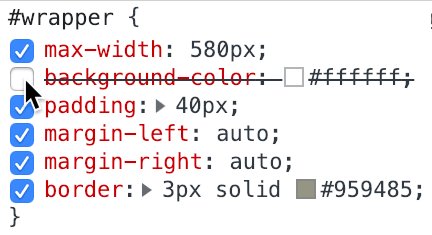
Hover over the properties for the #wrapper rule and notice that checkboxes appear next to each property. Try unchecking and checking the properties to see how you can temporarily disable and re-enable the property in the browser. When a property is disabled, it will appear with a strike-through:
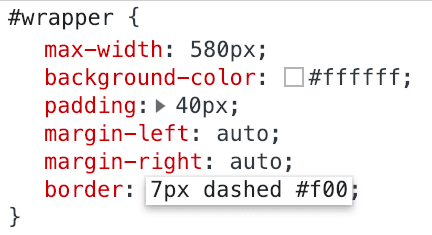
- Find the border property and click on the value that’s there (3px solid #959485).
Type in 7px dashed #f00 to see how the browser displays the change:
NOTE: Other possible values for border style are dotted, double, groove, ridge, inset, and outset.
Hexadecimal Shorthand
When a CSS color hex value contains 3 identical pairs, it can be written as a 3-digit shorthand
#fff(instead of the 6-digit#ffffff). Shorthand can only be used for colors with 3 identical pairs of characters. Instead of#33cc66you could write#3c6. Colors such as#0075a4cannot be shortened.- Play around for a bit and have fun. Remember, the changes you make to the code in the DevTools are temporary. To save the changes you would need to remember the new values and then code them into your CSS file in your code editor.
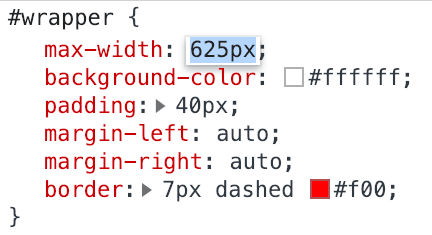
- Find the width property and click on the value to highlight it.
As you do the following, watch how the wrapper div’s width is updated live in the browser window:
- Hit the Up Arrow key on your keyboard to increase the value 1 pixel at a time.
- Hit the Down Arrow key to decrease the value.
- Hold Shift while hitting the Arrow keys to change the value 10 pixels at a time.
Reload the browser to return to the originally assigned values.
We don’t want to actually modify this element’s width or border, but this gives you a sense of how a browser’s DevTools can help you understand and figure out your CSS by providing immediate visual feedback on your changes.
Let’s put what we’ve learned to some use in fine-tuning this particular page.
Fine-Tuning Margins for the Main Heading
- Look at the main heading of the page (Latest News from the Onion: Today’s Top National Headlines) and notice that the space around the heading is uneven. There’s way more space above the heading than on the left. Let’s balance out this space.
- On the left side of the DevTools, find the
<h1>tag. Hover over the
<h1>tag and, as you do so, look at the way it is highlighted in the browser window above. You should see an orange-colored highlight above and below the header. The orange color indicates that there is a margin present: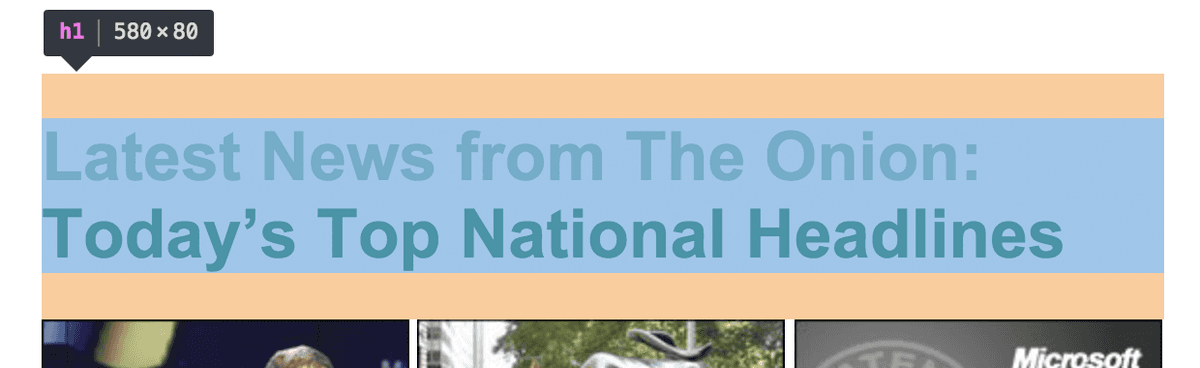
- Click on the
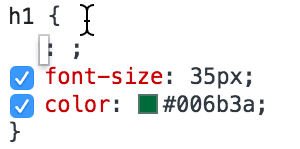
<h1>tag in the DevTools to select it. You will now see the Styles associated with the h1 on the right side of the DevTools. - In the Styles panel of the DevTools, notice that we did not add any margin to h1 to the CSS in the style tag embedded into index.html but, just below that rule, you’ll see rules added by the user agent stylesheet. This is styling the browser does by default. All browsers add margin to the top and bottom of headings, paragraphs, and lists. Let’s override this.
In the Styles section of DevTools, to edit our rule for h1, click once inside the opening curly brace:
Type margin-top and hit Tab. Then type 5px
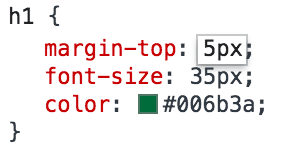
- Use the Up Arrow and Down Arrow keys on your keyboard to modify the margin. Notice that the space looks more even when margin-top is set to 0px. Let’s add this CSS to our actual code to lock it in.
- You should still have index.html open in your code editor. If not, open it now.
Find the h1 rule (near the top of the style tag) and add the following code shown below in bold:
h1 {
   margin-top: 0;
   font-size: 35px;
   color: #006b3a;
}
NOTE: In CSS, you almost always specify a unit of measurement (such as px) for a numeric value. Because zero is always zero, regardless of the unit of measurement, you do not need to specify px when coding 0 (zero).
- Save the file.
Return to the browser and reload index.html to see the final change to the code.