Targeting HTML Elements
What This Tutorial Covers
Selectors
$('selector') uses CSS-style queries.
Filtering
.filter() and .find() narrow selections.
Traversal
Walk up and down the DOM tree.
Noble Desktop's JavaScript Development Certificate teaches modern JavaScript and React.
Delve into this comprehensive JavaScript and jQuery tutorial where you'll learn about using Chrome's DevTools, selecting HTML elements, manipulating selected elements, and getting & setting properties.
Exercise Preview
Getting Started
- On your Desktop, navigate into Class Files > yourname-JavaScript jQuery Class > Form-Fields folder.
- We want to use Chrome’s Developer Tools (DevTools), so we’ll open our page in Chrome. CTRL–click (Mac) or Right–click (Windows) on form.html and choose Open With > Google Chrome.
- CTRL–click (Mac) or Right–click (Windows) anywhere on the page and choose Inspect from the menu.
- We can now see Chrome’s DevTools. All modern browsers have Developer Tools. We can diagnose problems here and see what the browser is doing. We can also see all of the HTML, CSS, and JavaScript that the browser is reading.
The DevTools window has several groups of tools organized into tabbed panels. By default, you should see that the Elements panel is open.
In the Elements tab you can inspect an HTML element and see its precise markup. Mouse over any of the lines of HTML. As you do so, you should see the corresponding element highlighted in the browser window.
- At the top left of the DevTools window, click the
 button. Now when you mouse over an element in the page, the corresponding HTML highlights in DevTools.
 - Click the button again to turn this off.
At the top of the DevTools window, click on the Console tab.
If there are JavaScript errors in the page, we will see them here. The Console is also a place where we can experiment safely with JavaScript.
- In the Console, type
alert('Hello');and hit Return (Mac) or Enter (Windows). - You should see a dialog that says Hello. Click OK to close the alert.
The Console lets us make temporary changes to the HTML page we’re looking at (even a working site). We’re going to experiment with hiding and showing various parts of this page.
Type document into the Console and hit Return (Mac) or Enter (Windows).
- You should see #document return in the Console. Mouse over the word #document and notice that the whole page is highlighted.
- Click the arrow next to #document to expand it. This is the whole HTML document, and contains everything on the page.
- Click the arrow next to
<body>to expand it, and see all of the contents of the body. Mouse over the various sections inside the
<body>and notice that those blocks of content highlight in the browser.
Selecting & Working with HTML Elements
We don’t typically want to make changes to the whole document all at once. We want to specify which HTML element we’d like to change. To get more specific, we can use the JavaScript method document.getElementById(). This dot syntax will become more familiar as we continue to dig deeper into accessing elements and their different properties as we go through the exercises.
- At the top left of the DevTools window, click the button.
- In the page, click on the text field under Name.
- In the DevTools, notice that the input with the ID nameField is highlighted.
In the DevTools, click on the Console tab.
In the Console, type
document.getElementById('nameField');About GetElementById()
The getElementById() method allows you to target any HTML element in the document by placing its ID as a string inside the method’s parentheses. Please note that the capitalization of Id in the name of this method must be correct for the code to function. However tempting it may be to write getElementByID(), the function will not work written this way.
- Hit Return (Mac) or Enter (Windows).
You should see
<input id="nameField … value="First and Last Name">in the Console.Mouse over this and notice that only the nameField input highlights. So far we’ve selected the whole element whose ID is nameField. We can get more specific and talk to this element’s styles by using dot syntax again.
- To save yourself some typing, press the Up Arrow key in the Console. This will show your last command so you don’t have to type it again. Very handy!
Add the following bold code to this previous command:
document.getElementById('nameField').style.display = 'none';This statement says to get the element with the ID nameField and set its display property to none, which will hide the input. Note that the property value (‘none’) must be a string.
- Hit Return (Mac) or Enter (Windows) to execute the code and notice that the input disappears!
- Let’s get the nameField to reappear. In the Console, press the Up Arrow key again to show your last command.
Change the code as shown in bold:
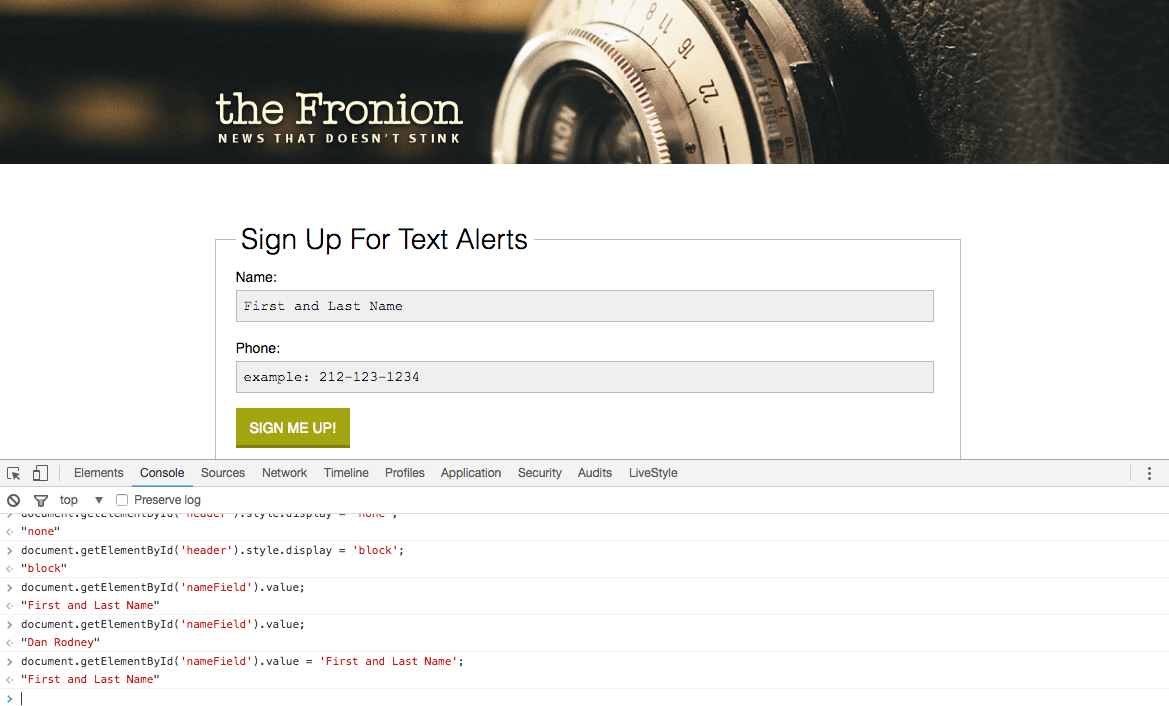
document.getElementById('nameField').style.display = 'block';Hit Return (Mac) or Enter (Windows). The input should reappear.