Trading Comps - Model 1
Build a Financial Model
Lay Out Assumptions
Inputs at the top, color-coded blue — never hardcoded in formulas.
Build the Income Statement
Revenue, COGS, OpEx, EBITDA — driven by assumptions.
Add Balance Sheet
Working capital, fixed assets, debt — must balance.
Cash Flow Reconciles
Operating, investing, financing — ties to balance sheet cash.
Noble Desktop's Financial Analyst Training Program covers financial modeling, valuation, accounting, and Excel for finance.
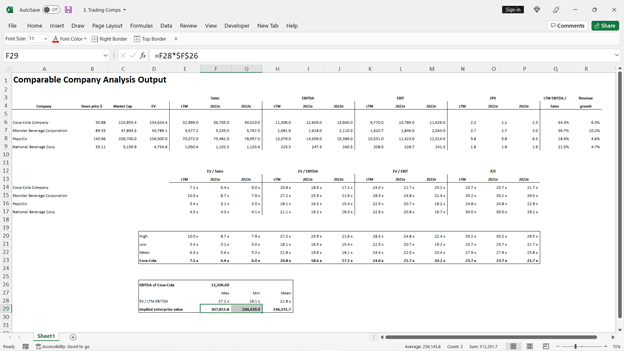
Explore our in-depth analysis of the financials and value drivers of three major beverage companies: Coca-Cola, Monster Beverage Corporation, and PepsiCo, with a specific focus on interpreting multiples statistics and implied enterprise value.
We have three comparable companies: Coca-Cola, Monster Beverage Corporation, and PepsiCo.
We calculated share price, market cap (equity value), and enterprise value for each company.
We also calculated value drivers such as Sales, EBITDA, EBIT, and EPS.
Let’s calculate multiples statistics:
E13==$D6/E6
I13=$D6/I6
M13=$D6/M6
Q13=$B6/Q6
Coca-Cola is just along the lines with its peer group.
From here we can interpret the outputs. The most convenient way is to put the highest and lowest multiples together with the mean and the company we are valuing.
E20=MAX(E14:E17)
E21=MIN(E14:E17)
E22=AVERAGE(E14:E17)
E23=E14
EBITDA of Coca-Cola: F26=H6
EV / LTM EBITDA: Max=F28=H20; Min=G28=H21; Mean=H28=H22
Implied EV = f29=F28*$F$26
Implied EV range is from $204B to $307B.