Financial Risk
Financial Risk Categories
Market Risk
Losses from price changes — equities, rates, FX, commodities.
Credit Risk
Counterparty defaulting on obligations.
Liquidity Risk
Unable to convert assets to cash without major loss.
Operational Risk
Internal failures — people, processes, systems.
Noble Desktop's Financial Analyst Training Program covers financial modeling, valuation, accounting, and Excel for finance.
Explore the different types of warning signs, business and financial risk, that are considered in credit rating calculation and delve into the common financial indicators used by credit analysts to determine a borrower’s risk of default.
Financial risk and business risk are two different types of warning signs that are considered in credit rating calculation.
Financial risk refers to a company's ability to manage its debt and financial leverage. To evaluate the financial risk we consider:
- Accounting policy of this company
- Financial policy and governance
- Cash flow adequacy
- Capital structure
- Liquidity
Free cash flows, debt to capital ratio and interest cover ratio are all common financial indicators credit analysts rely upon to determine a borrower’s risk of default in the credit process
Free Cash Flow
Free cash flow (FCF) tells a bank exactly how much cash is available for a company to repay its debt after all necessary expenses are made.
FCF = EDITDA – Interest – Taxes +/- working capital +/- other operational liabilities – capital expenditure.
Free cash flows near zero or negative could indicate higher default risk. It is important to note in the above formula that interest is subtracted from EBITDA. This is different from unlevered free cash flows and provides more detail into how credit rating agencies review cash flows.
Debt to capital ratio
The debt to capital ratio shows a company’s debt as a percentage of its total capital. A higher debt-to-capital ratio indicates higher default risk.
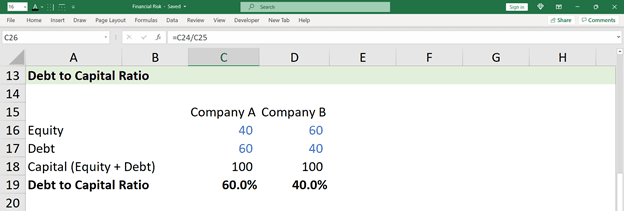
In the example above, company A has a higher debt to capital ratio and consequently higher default risk than company B.
Interest Coverage Ratio
The interest coverage ratio analyzes the relationship between a company’s earnings and its interest obligations. It is calculated by dividing a company’s EBIT by its interest expenses for the period.
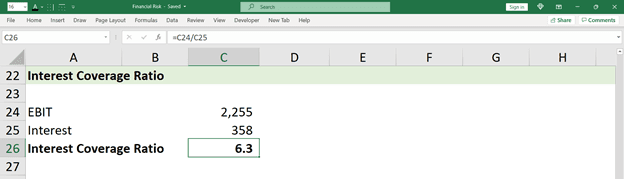
The higher the interest coverage ratio, the lower is the company’s default risk. An interest coverage ratio of 1.5 or below raises doubts about the company’s ability to fulfill its interest obligations. In the example above, the interest coverage ratio is 6.3, which is very comfortable.
Business and Financial Risk Combined help the rating agencies to come up with the accurate credit rating for the industry and companies.