Why Choose Tableau for Your Data Visualizations?
Tableau Advantages
Speed
Builds graphs much faster than Excel — algorithms format intelligently with the Show Me panel.
Powerful Integrations
Connects to Excel, text files, even tables in PDFs, plus your organization's database.
Scalability
Handles big data without breaking — Excel chokes where Tableau scales.
Free Public Version
Tableau Public is free for individuals and teams getting started.
Noble Desktop's Data Analytics Certificate covers Tableau alongside SQL, Excel, and Python.
Explore the ways in which Tableau, a leading data visualization tool, offers remarkable speed, powerful integration, and impressive scalability, and discover how you can get started with this comprehensive software.
How Does Tableau Compare to Other Tools?

There are many reasons why a vast majority of businesses have adopted Tableau:
Speed
It takes much less time to create graphs in Tableau compared to software like Microsoft Excel. Besides, unlike Excel, Tableau uses algorithms to format your graph intelligently, leveraging most of the heavy lifting in data analysis.
Tips: Select your data fields in Tableau, and use the Show Me Panel feature to quickly browse through possible graphs to represent your data.

Powerful Integration
Tableau allows you to work with your raw data in many formats: Excel files, text files, and even tables from pdf documents from which Tableau can extract the data. Tableau can also connect to your organization's database.
Tip: Cleaning up the data using the data interpreter with a simple click.
Tableau has a functionality named the Data Interpreter. Use it to clean your imported Tables and remove any unnecessary information that is not part of your dataset.

Scalability
While Excel cannot handle a large amount of data, Tableau is robust and doesn’t break when importing big data.
Tableau works like an all-in-one tool; you do not need to jump to another tool to create your presentations for your data. In Tableau, it is all integrated.
Tableau goes further by allowing you to create Dashboards. One of the most important parts of how Tableau works with the dashboard is that your data is interactive. You can control your dashboard, and your dashboard automatically updates to show you the data you have queried.
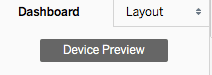
Tip: Click on the Device Preview button in your Tableau dashboard to customize it to various device sizes (desktop, tablet, or phone), with many layout sizes to choose from.