Pandas Library Overview
What This Tutorial Covers
DataFrames
Tabular data structure with labeled rows and columns.
Indexing
loc and iloc for label and position access.
Group-By
Aggregate data by categories with .groupby().
Noble Desktop's Data Science & AI Certificate teaches Python in depth — from data analysis through machine learning.
Learning how to manipulate your dataset using Pandas is a critical skill and this tutorial will cover some essential Pandas operations.

Loading Dataframes
You’ll most likely be loading either a CSV or an Excel file into Pandas. Let’s concentrate on those two first. We’ll make our own data to turn into a CSV and then we’ll read it in Pandas. We’ll pretend that we are veterinarians and we have data on clients’ pets and how much they owe us.

In this code we created a dataframe using pandas but we’ll have to transform it into a CSV. We can do that by using one of Pandas’ methods called “.to_csv()”.
 You first have to save it as a CSV in your working directory. Your directory path might differ based on where you’re working from. Once you’ve customized your path, you can use Pandas’ ‘.read_csv()’ to transform it into a Pandas dataframe.
Congrats on making your own dataframe from scratch but we’re not done yet! As you were about to start munging some data, we found a secret Excel file that contains a list of pet’s ‘bad score’. Guess nobody’s perfect. Let’s add an Excel file to Pandas.
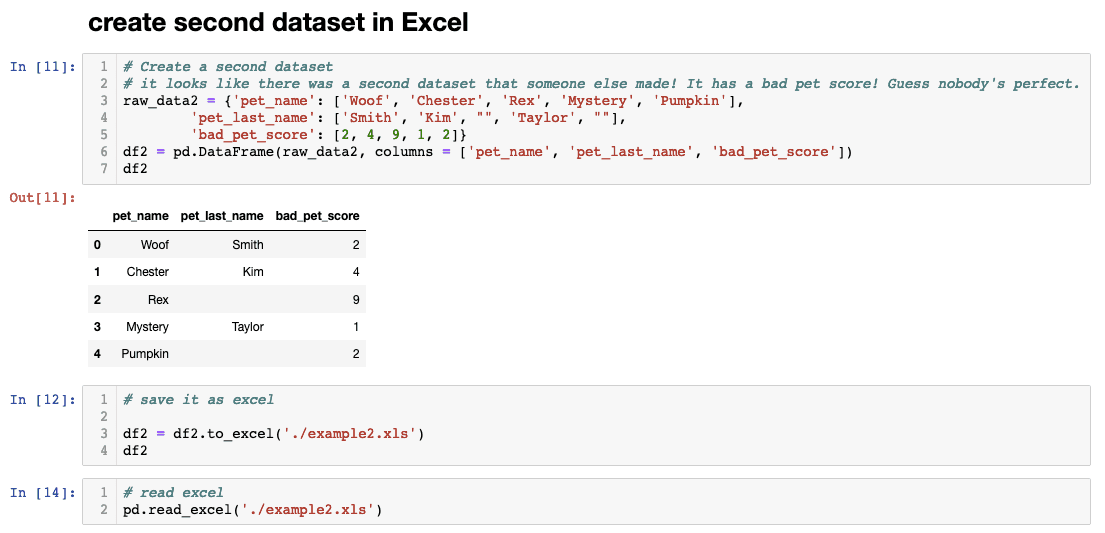
One of the coolest things about Pandas is the ability to convert diverse data sources like CSV, Excel, JSON, and.txt data into one file type that could be munged together. Now that we have two dataframes, let’s join them together.
Joining and Dataframes
When different dataframes share the same column, it can be used to merge two dataframes together. You might have noticed the two dataframes we have share the same pet names columns. Let’s use this tack on the pet’s “bad score” and have a more complete dataframe.

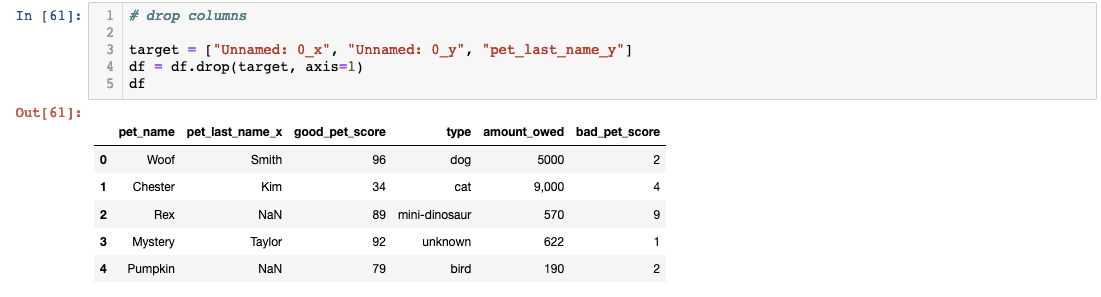
I’ve merged the two dataframes on pet_name but Pandas automatically altered the column names for duplicate postings to differentiate them. Also, note that I’ve repurposed the variable “df” and assigned it to a new value that contains both dataframes. There are many different ways to join dataframes and you can learn more about it here. For now though, let’s continue with our example and clean up redundancies by dropping and renaming our columns.
Adding and Deleting Columns
Let’s start by cleaning up some redundant columns and drop columns that have “y” tacked on the end. We can also drop the “Unnamed: 0_x” column as well because it was created as an index automatically by Pandas.
We can also rename the column header to change “pet_last_name_x”:

It is important to use “inplace = True” to ensure the changes remain. Try it for yourself and see what the difference is.
Did you notice how we have good and bad scores? Let’s create a new column called “total_score” that shows the positive score subtracted by the negative.
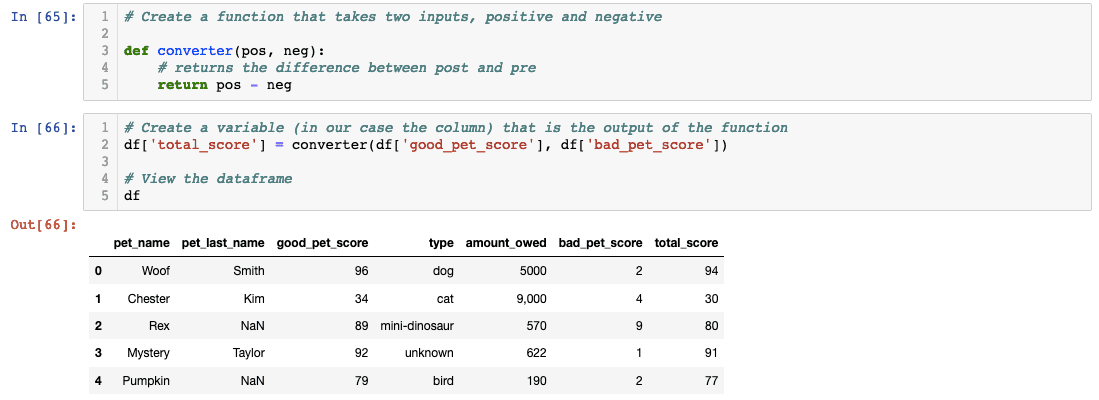
We created a function to take in two arguments (pos and neg) that returns pos-neg. Then on the next cell, we created a new variable called “total_score” that the function will output to. When you create new columns based on your original column, it’s called feature engineering!
Deleting Null Values
You probably noticed that some of the pets in our database are missing last names. In our scenario, let’s say pets with no last names are from the shelter and we did some pro bono work. We are not going to charge the shelter so let’s drop those pets from our database.
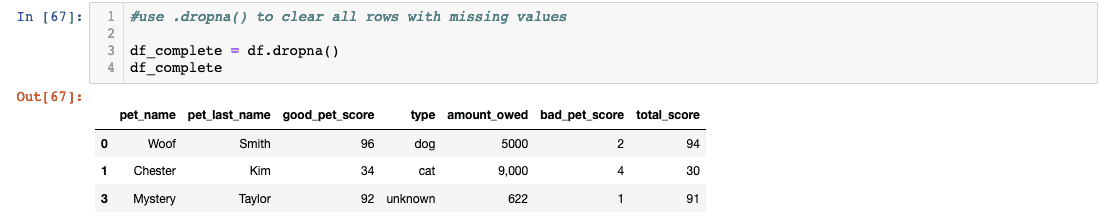
We created a new variable called df_complete instead of overwriting the old one just in case we need it. Congrats on sticking with it so far and cleaning up a database using Pandas! As a bonus, let’s see if we can do a little analysis.
Analysis and Checking Data Types
Let’s use our previous dataframe df to do a little data visualization and analysis. I want to see if there’s a correlation between the amount owed and the total score of the pet. Assuming the lower the score a pet has, the higher the bill will be since it is getting into some sort of trouble or eating things it shouldn’t eat.
Pandas has a built-in method called.corr() that we can use to check correlation between two columns.
 If you type the code above, you’ll see an error message below that says, “unsupported operand type(s) for /: 'str' and 'int'”. It looks like we have a data type problem because Pandas can’t check for correlation if the data type is a string. String data type means letters and characters. A number can be a string as well and it is a common occurrence. Let’s check if our hunch is correct.
You can check the data type by tacking on.dtype after a column variable. You can see that total_score is labeled int64 which stands for integer 64bit. However, the amount_owed is ‘O’ which stands for Object. This means the data type is a string or mixed. Let’s change it to int64.

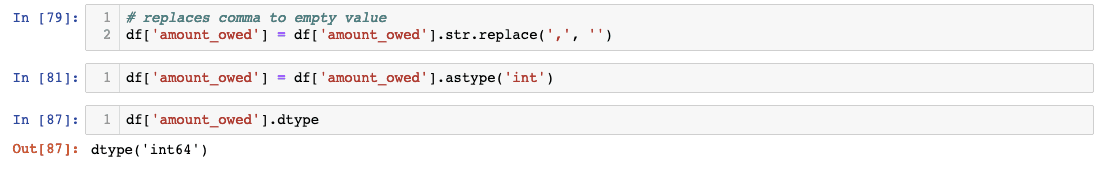
First, we need to get rid of the comma that is preventing us from changing the dtype to integer. Afterwards, we need to change the column’s data type to integer. Here’s how we can do that.
Now let’s see if we can use Pandas’.corr() method to check the relationship between total score and amount owed.
If we type df['total_score'].corr(df.['amount_owed']) then we get -0.722088.
We can see that there is a strong negative relationship between the total score and the amount owed. This translates as there is no relationship between the score and the amount owed. There are ways to visualize it using Seaborn or Matplotlib but it is outside our scope for today. Hope this tutorial demonstrated how powerful and useful Pandas is for data munging and exploration!