March 23, 2026/3 min read

Mode in Python

Master Statistical Mode Calculations in Python Programming

Real-World Application

Mode is essential for finding the most frequently occurring values in datasets, making it invaluable for business analytics and data-driven decision making.

Statistical Measures for Business Analytics

Mean

Best for calculating average values but sensitive to outliers like expensive corporate catering orders.

Median

Ideal for finding the middle value in datasets with outliers, perfect for typical order pricing analysis.

Mode

Essential for identifying the most popular items or frequently occurring values in customer data.

Mode Application

Imagine you're consulting for Chipotle, tasked with delivering actionable insights about customer ordering patterns and transaction values. The statistical measure you choose can dramatically impact the strategic recommendations you provide. For analyzing order size, both mean and median offer value, but the median proves superior in this context. Why? Corporate catering orders, bulk purchases for events, and occasional high-value transactions create significant outliers that would skew the mean upward, misrepresenting the typical customer experience that drives 80-90% of Chipotle's revenue.

The median gives Chipotle's executives a realistic picture of their "typical" customer transaction value—crucial for pricing strategies, promotional targeting, and location-specific inventory planning. However, when it comes to understanding menu popularity and customer preferences, neither mean nor median provides meaningful insight. This is precisely where mode becomes invaluable. By identifying the most frequently ordered items, Chipotle can optimize their supply chain, streamline kitchen operations, and develop menu innovations that align with proven customer preferences. This data-driven approach has become even more critical in 2026's competitive fast-casual landscape, where operational efficiency directly impacts profitability.

Understanding mode's practical applications is essential, but let's address the computational reality: calculating mode manually is tedious and error-prone. The traditional approach—sorting data points and manually tallying frequencies—becomes impractical with real-world datasets containing thousands of daily transactions. While we'll briefly cover the manual process for conceptual understanding, remember that modern data analysis relies on computational tools for accuracy and efficiency.

This brings us to the core focus of this tutorial: implementing mode calculation in Python. Understanding the underlying logic isn't just academic—it's essential for debugging, optimizing performance, and making informed decisions about when to use built-in libraries versus custom implementations. As we'll demonstrate, even a seemingly simple statistical measure like mode can present interesting programming challenges.

If you're new to Python programming, we recommend pausing here to build your foundational skills through a comprehensive Python Course—available both online and in-person in NYC. The following implementation deliberately avoids external libraries to illustrate the underlying logic. While this approach is more complex than using established libraries like NumPy or SciPy, it provides crucial insight into how these tools work under the hood. In subsequent articles, we'll explore how Python's rich ecosystem of libraries can streamline these calculations significantly.

*Important note: The following code prioritizes educational value over brevity. In production environments, you'd typically leverage optimized libraries. However, understanding manual implementation helps you troubleshoot library behavior, optimize for specific use cases, and make informed architectural decisions in your data analysis workflows.

Statistical Measures for Chipotle Data Analysis

FeatureOrder Size AnalysisMenu Popularity Analysis
Best StatisticMedianMode
ReasoningAvoids outlier biasShows frequency patterns
Business ValueTypical order pricingMost popular items
Data TypeNumerical (prices)Categorical (menu items)
Recommended: Use median for order pricing and mode for menu item popularity to get actionable business insights.

Manual Mode Calculation vs Python Libraries

Pros
Deep understanding of the underlying mathematical process
Better debugging skills when library functions fail
No external dependencies required
Educational value for programming fundamentals
Cons
Time-consuming and error-prone implementation
Complex code for simple statistical operations
Reinventing existing optimized solutions
Maintenance overhead for custom functions
Prerequisites Required

This tutorial assumes Python programming experience. Those new to Python should complete a foundational course before proceeding with statistical implementations.

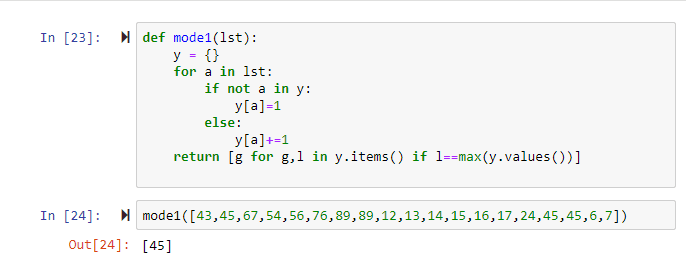
Step-by-Step Tutorial

  • Step 1: Create a function called mode that takes in one argument—your dataset as a list or iterable

  • Step 2: Initialize an empty dictionary to serve as a frequency counter for each unique value

  • Step 3: Implement a for-loop that iterates through each element in your input dataset

  • Step 4: Use conditional logic (if-else statements) to count occurrences of each unique value in the dictionary

  • Step 5: Return a list comprehension that identifies dictionary entries with maximum frequency values

  • Step 6: Test the function with sample data to verify it correctly identifies the most frequently occurring values

Python Mode

Building a Mode Function in Python

1

Function Definition

Create a function called mode that accepts one argument representing the dataset to analyze

2

Dictionary Initialization

Create an empty dictionary variable to store frequency counts for each data point

3

Data Iteration

Implement a for-loop that iterates through each element in the argument variable

4

Frequency Counting

Use if-not loop and else combination to count occurrences of each value in the dataset

5

Mode Identification

Return a list comprehension that processes the dictionary and identifies the most frequently occurring value

6

Function Testing

Call the function with a list of numbers to verify it correctly returns the mode of the dataset

Implementation Checklist

0/6
Learning Philosophy

While this manual implementation is complex for a simple problem, understanding the underlying logic prepares you to effectively use and troubleshoot statistical libraries in production code.

Key Takeaways

1Mode is the most appropriate statistical measure for identifying frequently occurring values like popular menu items
2Median is preferred over mean for financial data when outliers like corporate catering orders exist
3Manual implementation of statistical functions provides essential understanding of underlying algorithms
4Python libraries simplify statistical calculations but require foundational programming knowledge
5Dictionary-based frequency counting is the core mechanism for mode calculation in Python
6Business applications of mode include customer preference analysis and inventory optimization
7Understanding manual calculations helps with debugging when library functions encounter issues
8The six-step tutorial approach breaks down complex statistical programming into manageable components

RELATED ARTICLES